Top

Archive | News

NHANES – beyond nutrition to prescription meds

NHANES prescription medication data hasn’t always been on my radar.

I’m not sure why this was so. NHANES is a well known national survey that began as a nutrition survey and quickly expanded to include a range of health variables, including results of a physician exam and laboratory tests. It is a national probability based sample, which means that one can generalize from the NHANES to the entire United States, and its methodologic standards are of the very highest. Perhaps the reason that I overlooked the prescription medication data is that there is so much data, and also, that NHANES was known primarily for nutrition data. Getting past my own blind spot, I decided to take a closer look at the prescription medication data collected in NHANES.

Here are some key points.

The survey

NHANES began in the 1960s and was conducted in waves, with a NHANES I, NHANES II and NHANES III. We love it so much that it became a permanent fixture. Since 1999 it has been conducted continuously in two-year cycles, and is now called NHANES continuous, or just NHANES. The US population is sampled over a two-year cycle and the data need to be analyzed using the full two-year sample. The sample is representative of the non-institutionalized, U.S. population and for example, does not include residents in nursing homes, or people in prison.

Sample size

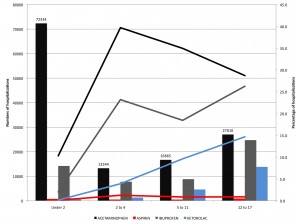
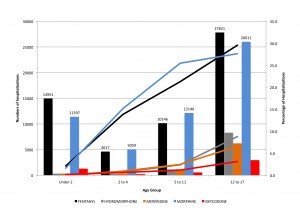
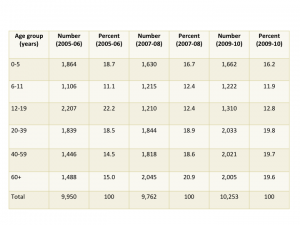
Sample size is critical to being able to estimate drug utilization. Unweighted sample sizes by age group are listed in the table below. While the numbers are large (every one of these people was interviewed in their homes), they may not be large enough for many purposes in pharmacoepidemiology. For those of us interested in pediatric medication use there were 4,194 people under 20 included in the sample. When stratified into age groups, the sample might not be large enough to study medications taken by small percentages (fewer than 1%) of children. The table below is taken from the NHANES website and shows unweighted sample sizes.

Table 2. Unweighted sample size and percents by age groups from NHANES 2005-06, 2007-08 and 2009-2010 for examined participants

NHANES prescription medications

NHANES prescription medication information

The medication information is collected during an in person interview in the participant’s home. During the interview, survey participants are asked if they have taken medications in the past 30 days for which they needed a prescription. Those who answer “yes” are asked to show the interviewer the medication containers of all the products used. For each medication reported, the interviewer enters the product’s complete name from the container into a computer. If no container is available, the interviewer asks the participant to verbally report the name of the medication. Participants are also asked how long they had been taking the medication and the main reason for use. This is in contrast to databases that rely on billing or claims data, or electronic health records. Documentation about the 2011-2012 data files containing prescription medication can be found here.

Using NHANES prescription medication data for pharmacoepidemiology

The pros and cons of using NHANES for pharmacoepidemiology are straight forward. On the pro side, NHANES may be the only probability based population sample in the United States with medication information. This alone makes it extremely valuable, and useful in conjunction with other types of data. The second strength, is that unlike health records, claims, or prescription data bases, the NHANES documents the presence of the medication in the patient’s home, demonstrating the the prescription was purchased and brought home. Along the continuum of measures, beginning with prescriptions written and prescriptions filled, documenting the prescription in the patient’s home brings us closer to understanding true exposures and levels of use. Another positive that needs to be explored is the availability of information from the physical exam and laboratory tests for the person using a given prescription.

On the con side, the sample sizes may be too small to provide stable estimates of many medications, especially if one wishes to study use within a sub-group. In terms of bias, my first thought is that this method of estimating use will result in underestimates of use, with people forgetting, omitting or otherwise not reporting their medication use to an interviewer. Misclassification in the other direction might occur when a person has filled a prescription and shows the prescription to the interviewer, but does not take the prescription. This latter source of bias would lead to an over-estimate of use but would also effect each of the other types of measures of prescription medication use (prescriptions written or prescriptions filled also over-estimate the numbers of people actually using the medication.

Recent publications using NHANES prescription medication data

A quick search turns up several publication analyzing prescription medication data in NHANES, but not as many as one might expect. An interesting use of the data is that of Bateman and colleagues (2012) focusing on a group with a risk factor, hypertension, and describing the medication use within that group. This usage may have applications for people working in health economics and outcomes research.

  • Farina EK, Austin KG, Lieberman HR, “Concomitant Dietary Supplement and Prescription Medication Use Is Prevalent among US Adults with Doctor-Informed Medical Conditions” J Acad Nutr Diet 2014 Apr 4 S2212-2672(14)
  • Bertisch SM, Herzig SJ, Winkelman JW, Buettner C, “National use of prescription medications for insomnia: NHANES 1999-2010” Sleep. 2014 Feb 1;37(2):343-9
  • Chong Y, Fryer CD, Gu Q, “Prescription sleep aid use among adults: United States, 2005-2010” NCHS Data Brief. 2013 Aug;(127):1-8
  • Gu Q, Burt VL, Dillon CF, Yoon S, “Trends in antihypertensive medication use and blood pressure control among United States adults with hypertension: the National Health And Nutrition Examination Survey, 2001 to 2010” Circulation. 2013 Jun 18;127(24)
  • Bateman BT, Shaw KM, Kuklina EV, Callaghan WM, Seely EW, Hernandez-Diaz S, “Hypertension in women of reproductive age in the United States: NHANES 1999-2008” PLoS One. 2012;7(4):e36171
  • Kinjo M, Setoguchi S, Solomon DH, “Antihistamine therapy and bone mineral density: analysis in a population-based US sample” Am J Med. 2008 Dec;121(12):1085-91

Systematic Literature Review – a quick overview

Recently, I conducted a training workshop for a company conducting systematic literature reviews.

The group was young, energetic, hardworking. The biggest problem? Communicating with the clients. This is a field that is growing rapidly, and the buzz is getting louder. Clients want and need systematic literature reviews, and they want one that has every bell and whistle and covers every conceivable question. How to communicate to clients the importance of a focused approach, and the benefits of restricting a search?

I began with an overview of the basics.

Systematic literature review is an organized method of locating, assembling, and evaluating a body of literature on a particular topic using a set of specific criteria. The systematic review may also include a quantitative pooling of data, called a meta-analysis.

Younger professionals starting out may not know how “literature reviews” used to be done. I call it, “The Old Way of gathering information.” We used to go to our bookshelf, pull down a textbook, take the list of references to the library, and obtain and read references (remember standing in line for the photocopier?). Maybe we would search for references cited in first batch of references, and then we would write our “review”. Even then, we should have considered the problems. Text books are not current or comprehensive and the approach is highly variable; different people have different text books on their book shelves and will come up with different groups of references, resulting in variability in conclusions. As the volume ?of information increased over the past decades, the old approach became impractical and insufficient.

Some very far-sighted thinkers began exploring the scientific challenges of combining information from more than one study, as a way of coping with the increasing volume and pace of information flow, and synthesizing conflicting findings from different studies. Fast forward to the present, and a highly developed methodology that is used throughout the world to address a range of scientific questions:

  • Find out what’s been done
  • Identify research gaps
  • Refine research questions
  • Assess medication efficacy and safety

These questions have relevance to guideline developers, clinicians, pharmaceutical companies, regulatory agencies, insurers, and others.

This figure illustrates the key attributes of systematic literature reviews.

Systematic literature review

Systematic literature reviews are: Systematic, Comprehensive, Replicable, and Documented. It looks simple, but it involves careful methodology and attention to detail.

Fortunately there is a growing body of resources available, including three of my favorites:

In addition to providing workshops and training in systematic literature review and meta-analysis, Dr. Lasky co-taught the student workshop on Systematic Literature Review and Meta-analysis in Pharmacoepidemiology at ICPE 2013.

Ch 4 Mechanisms of health disparities

Infographics are a great way to begin a discussion about mechanisms of health disparities.

Infographic mechanisms of health disparities

Conceptual model: Mechanisms of health disparities

This infographic illustrates multiple potential pathways leading from race and ethnicity to disparities in health outcomes, mechanisms of health disparities. Chapter 4 of “What Pharmacists Need to Know About Racial and Ethnic Health Disparities” explores mechanisms and explanations and provides students with tools for understanding this complex topic.

The visual can provoke thought, raise questions, and educate, all at the same time. The infographic suggests pathways, but doesn’t cover them all. The student can take this infographic, generate hypotheses, and explore relationships.

For example, a student might begin with the association between race and ethnicity and socio-economic status, and then follow the pathways leading through occupation, income, education or neighborhood, which then lead through variables such environmental exposures, ability to understand health information or health insurance coverage, and then to health outcomes.

Another set of pathways might begin with the association between race and ethnicity and culture and religion (another broad area, in itself). One can follow the pathways through behaviors such as diet, reproductive practices, attitudes towards medication, education and occupation, and lead to differences in risk factors and health outcomes.

Chapter 4 also explores direct effects of race or ethnicity on health – and discusses the landmark study “The effect of race and sex on physicians’ recommendations for cardiac catheterization” that was published in the New England Journal of Medicine in 1999.

“What Pharmacists Need to Know About Racial and Ethnic Health Disparities” – a text tailored for pharmacy students.

Available on amazon.com

Visualizing Health

From the Robert Wood Johnson Foundation and the University of Michigan Center for Health Communications Research

We’re starting to see the fruits of all the excitement about data visualization and health, notably this thorough report from Visualizing Health, a project of the Robert Wood Johnson Foundation and the University of Michigan Center for Health Communications Research.

As they state,

In theory, data can help us make better decisions about our health. Should I take this pill? Will it help me more than it hurts me? How can I reduce my risk? And so on.

But for individuals, it’s not always easy to understand what the numbers are telling us. And for those communicating the information – doctors, hospitals, researchers, public health professionals — it’s not always clear what sort of presentation will make the most sense to the most people.

Their web site contains examples of tested visualizations, and what’s especially nice, they’ve done research assessing reactions from the general public. They’ve created a gallery of graphs, charts, and images, and they’ve done the hard work of evaluating them.


from Visualizing Health, one of their data visualizations

one of their data visualizations

Among the goodies, a “wizard” tool to help you learn more about a risk you want to communicate, and a sample risk calculator that shows off some of the best design concepts.

I like the way they’ve identified use cases:

  • Tradeoffs between medication or treatment options?
  • Relating biomarkers (such as BMI or cholesterol levels) to risk?
  • Health risk assessment output?
  • Population risks: disparities?
  • Population risks: emergent disease (“Should I worry about that measles outbreak?”)
  • Understanding multiple side effects?Understanding unique side effects?
  • Motivating a risk-reducing action?
  • Understanding tradeoffs that change over time over time?
  • Small risks, and understanding how to reduce small risks?
  • Explaining what “average years saved” means for an individual person?

I like the way they describe their methodology, using three tools to test their images (google consumer surveys, survey sampling international, and amazon mechanical turk). Transparency is always appreciated!

And, at the back of the report (why at the back?) a comic book style presentation on visualizing health in practice, using images to educate patients about diabetes.

about health literacy

about health literacy

Pain meds used by children while in the hospital

Pediatric pain medications

When children are in the hospital, they often need pain relief or sedation, yet most drugs used for pain relief or sedation in children have not been studied in children. A first step in understanding the overall use of pain medications is to document the medications used and their frequency of use. Our publication, “Use of Analgesic, Anesthetic, and Sedative Medications During Pediatric Hospitalizations in the United States 2008”, published in the journal, Anesthesia and Analgesia in  2012, describes medications used in over 800,000 hospitalizations.

We describe use of analgesics, anesthetics, and sedatives in pediatric inpatients by conducting a statistical analysis of medication data from the Premier database. We identified all uses of a given medication, selected the first use for each child, and calculated the prevalence of use of specific medications among hospitalized children in 2008 as the number of hospitalizations in which the drug was used per 100 hospitalizations. Dose and number of doses were not considered in these analyses.

The dataset contained records for 877,201 hospitalizations of children younger than 18 years of age at the time of admission. Thirty-three medications and an additional 11 combinations were administered in this population, including nonsteroidal antiinflammatory drugs, local and regional anesthetics, opioids, benzodiazepines, sedative-hypnotics, barbiturates, and others. The 10 most frequently administered analgesic, anesthetic, or sedative medications used in this population were acetaminophen (14.7%), lidocaine (11.0%), fentanyl (6.6%), ibuprofen (6.3%), morphine (6.2%), midazolam (4.5%), propofol (4.1%), lidocaine/ prilocaine (2.5%), hydrocodone/acetaminophen (2.1%), and acetaminophen/codeine (2.0%).

Use changed with age, and the direction of change (increases and decreases) and the type of change (linear, u-shaped, or other) appeared to be specific to each drug.

Figure 1 shows the number and percentage of pediatric hospitalizations with nonsteroidal antiinflammatory drug (NSAID) use, by age group. Bars indicate number of hospitalizations. Lines indicate percentage of hospitalizations. Acetaminophen was considered in these analyses as an NSAID for the sake of categorical simplicity; however, pharmacologically, the antiinflammatory activity of acetaminophen is minimal, such that some do not consider it a true NSAID.

Pediatric pain medications by age group.

Figure 1. Number and percentage of pediatric hospitalizations with non steroidal anti-inflammatory drug (NSAID) use, by age group.

Figure 2 shows the number and percentage of pediatric hospitalizations with opioid use, by age group. Bars indicate number of hospitalizations. Lines indicate percentage of hospitalizations.

hospitalizations with use of pediatric pain medications (opioids), by age group.

Figure 2. Number and percentage of pediatric hospitalizations with opioid use, by age group.

See the accompanying editorial by Joseph Tobin, MD, “Pediatric Drug Labeling: Still an Unfinished Need”. As he says,

Chronic pain in children is seriously underrecognized in comparison with the prevalence of chronic pain in adults. This is one more circumstance in which labeling in children would be very beneficial to anesthesiologists and their patients.