Top

Archive | Health Services Research

Pediatric hospitalizations for mood disorders

Children get hospitalized for depression and bipolar disorders.

I wasn’t aware of how frequently this happens until I got my hands on some BIG DATA – the HCUP KID database of children’s hospitalizations. My colleagues and I analyzed hospitalizations in 2000, 2003 and 2006 and published our results in the journal, Child and Adolescent Psychiatry and Mental Health in 2011. For each of these years, we were able to look at records for over 2 million hospitalizations, and able to project these to the entire number of pediatric hospitalizations in the US in those years.

Some take home points

Percentages of hospitalizations where the principal diagnosis was a mental health diagnosis

  • In children age 15-17, 13.7 to 15.2% of hospitalizations had a mental health principal diagnosis
  • In children age 10-14, 15.0 to 15.6% of hospitalizations had a mental health principal diagnosis
  • In children age 5-9, 4.4 to 4.8% of hospitalizations had a mental health principal diagnosis accounted

The incidence of hospitalizations with mood disorders as the principal diagnosis compared to the entire population of children

12.1-13.0 out of every 10,000 children were hospitalized with mood disorders as the principal diagnosis in 2000-2006.

Age

The incidence of hospitalizations for children with mood disorders increased with age – this figure uses data from 2006 to show the trend.

Children mood disorders by age

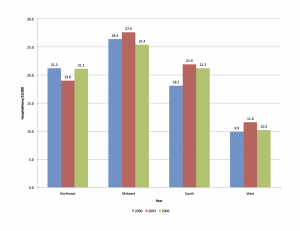
Region of the country

A surprising finding was the big differences between regions of the country. As an example, in 2006, the Western region experienced the lowest rates (10.2/10,000) while the Midwest had the highest rates (25.4/10,000). This figure shows the rates for 2000, 2003 and 2006.

children mood disorders by region of the US

Did you know?

Mood disorders including depression and bipolar disorders are a major cause of morbidity in childhood and adolescence, and hospitalizations for mood disorders are the leading diagnosis for all hospitalizations in general hospitals for children age 13 to 17.

Between 2000 and 2006, inflation-adjusted hospital charges increased from $10,600 to $16,300.

Morphine Use in Pediatric Inpatients

Pediatric morphine use in the hospital

As with so many medications used widely to treat children, morphine is not labeled for pediatric use. Describing patterns of use helps us understand how many children are receiving a drug that is not approved for pediatric use by the FDA.

A statistical analysis of 877,201 pediatric hospitalizations in the United States in 2008 estimated that morphine was used in 54,613 (6.2%) hospitalizations in the database. If this percentage is applied to the total number of children’s hospitalizations in the US in 2008, as many as 476,205 children will have received morphine during their hospital stay that year. Fractures and appendicitis were two of the diagnoses most frequently listed for children receiving morphine.

While morphine can be used safely for pain management during hospital procedures, and has been used for this purpose for several decades, the lack of pediatric labeling is undesirable. In a discussion about whether the off-label use of a drug constitutes experimentation and research, the American Academy of Pediatrics Committee on Drugs noted that “discussion about the off-label status of a drug may, as a matter of professional judgment, be part of the information provided to the patient or parents.”

The article reporting statistical analysis on morphine use in pediatric inpatients can be found here:”Morphine Use in Hospitalized Children in the United States: A Descriptive Analysis of Data From Pediatric Hospitalizations in 2008″Lasky T, Greenspan J, Ernst FR, and Gonzalez L Clinical Therapeutics 2012, 34(3): pp.720-727.

The American Academy of Pediatrics discussion on “Uses of drugs not described in the package insert (off-label uses)” can be found here. Pediatrics. 2002;110: 181–183.

Geographic Variation in Prescribing Practices

The authors used HEDIS quality measures, and mapped them by hospital referral region.

The map above shows variation in quality of prescribing high-risk drugs (medications considered to be high-risk for the elderly), and the map below shows variation in prescribing drugs with potentially harmful drug-disease interactions.

NEJM November 2010