Top

Archive | Health Services Research

The Learning Health Care System

Two meetings in one week with a strong emphasis on the learning health care system – an indication that ideas are taking hold.

At ISPOR 2015

The first plenary session, ‘Taking stock of the learning health care system: What have we achieved and why does it matter?” highlighted the issue with four speakers, two from PCORI, one from UnitedHealth Group, and a fourth from CareMore/Anthem. The session was full, and many of us listened from the overflow room. Penny Mohr (PCORI) presented this encouraging graph showing adoption of electronic health records (EHRs) by physician offices since 2001.

learning health system

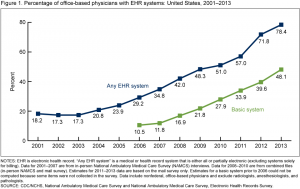
Adoption of EHRs in the US

At Stanford’s Big Data in Biomedicine Conference

Held over a three day period last week, and live streamed, this was only the third annual Stanford Big Data in Biomedicine Conference, and it was sensational. They closed with a session on Learning Health Systems, and featured four speakers: Amy Abernethy, Flatiron, Julia Adler-Milstein, U Mich, Chris Longhurst, Stanford, and Rob Merkel, IBM Watson Group. A very different group than the one at ISPOR, and very interesting to compare the approach and emphasis taken at both conferences in the same week.

Although all four speakers were excellent, I’d like to highlight the work of Chris Longhurst, co-author of the first published use of aggregated EHR data to influence a patient care decision in real time. When EHRs work smoothly, they can be queried by practicing physicians to learn from patient experience. This is not a clinical trial, and not even a retrospective cohort study, but it makes use of clinical experience to inform a discussion. Their most recent publication, “Bringing cohort studies to the bedside: framework for a ‘green button’ to support clinical decision-making” in the Journal of Comparative Effectiveness Research outlines the approach clearly, and the executive summary offers these succinct comments:

  • Electronic health records (EHRs) from past patients are a source of information, which reflects patient’s treatment choices and their effects as they happen in actual clinical practice.
  • This source of information is readily available and can be queried at the point-of-care to aid in decision-making for individual patients.
  • Real-time querying tailored to individual patients requires: EHR-based phenotyping; quantifying inter-patient similarity; optimal cohort selection; cohort visualization; automated confounder control and integrating results with clinical guidelines and existing evidence from clinical trials.
  • Real-time querying also requires real-time validation, an important open area of research. While bias from measured confounders can be minimized using automated propensity scores techniques, bias from unknown or unmeasured confounders can still threaten the validity of results. Evaluating results from cohorts with known estimates can increase confidence in these methods.
  • Results from point-of-care EHR-based cohort studies should not be looked at in isolation but be presented in the context of existing clinical guidelines and any available evidence from clinical trials.

They are beginning to implement a learning health care system, and set a model for how this might be achieved in other settings.

HEALTHy 2015!

Happy and healthy new year to all.

Looking forward, looking back, resolutions, predictions. There’s so much of that as the old year winds down and the new year comes in, and I decided to take my pick.

I’m looking forward to more collaborations in 2015 – both in the sense of projects to work on, but also, in the larger sense of increased collaboration health research cutting across sectors of the health community. I’ve been noticing a tendency for initiatives to involve more and more stakeholders and sectors, to create larger databases, to increase enrollment in studies, to obtain patient input, and for all the other good reasons out there.

An example is the Optum Labs collaboration to pool health care data, and translate research findings into improvments in patient care. Some partners include AARP, Harvard Medical School, the Mayo Clinic, Pfizer – you get the picture. What a welcome change from only a few years ago, when these organizations worked in isolation from each other!

Another massive collaborative health research effort is the Observational Medical Outcomes Partnership (OMOP), a public-private partnership to develop methods for using observational healthcare databases to study medical products. Partners include PhRMA, FDA, and the Foundation for the National Institutes of Health. The effort has led to another collaborative, Observational Health Data Sciences and Informatics (OHDSI, pronounced “Odyssey”), a multi-stakeholder, interdisciplinary collaborative to bring out the value of health data through large-scale analytics.

Collaborative health research is definitely in the air, and that is a fantastic change in the way we do things.

The UCSF blog put together its “Top Trends in Health and Science for 2015”, and second on their list is “Breakthroughs in Teamwork” with this quotation from Matthew State, MD, PhD, chair of Psychiatry,

One of the major drivers of recent progress has been a wholesale shift in culture. Investigators who were once fierce competitors are now finding ways to collaborate with one another in large-scale, multi-site genomic studies.

If someone else besides me is saying it, it must definitely be true! UCSF began an initiative in 2013 to promote team science, and they are taking serious measures to alter the academic climate and foster team approaches,

While scientific research is collaborative in its core, the traditional academic model rewards investigators who get primary credit for their research successes, including first or last authorship in published articles.

Here’s to more teamwork and collaboration in 2015, and lots of high quality science.

How much does your doctor’s visit/lab test/MRI/whatever, cost?

I don’t usually comment on health care costs – there are so many other people who have the economics and business background to address this important issue. I’m making an exception to highlight fellow Grinnellian, Jeanne Pinder, and her start-up, Clear Health Costs.

First, the bragging.

Jeanne is a Grinnell alum (like me!), and Grinnellians like to give each other a pat on the back. Grinnell is a small liberal arts college in the Midwest, and I always give it credit for instilling a great mix of academic excellence, creativity, independence, and integrity in its students and in me.

Clear Health Costs

Clear Health Costs

Jeanne Pinder left a career as a journalist at the NYTimes to found Clear Health Costs, a company that gathers information about health care costs and provides the information to the consumer. So, if you go to their website, you can specify the market (currently in NYC, SF, LA, Dallas-Fort Worth, Houston, San Antonio, and Austin) and look up prices for a walk-in clinic visit, mammogram, vasectomy, teeth filling, and much more. You can then CHOOSE where you want to go!!

This is clearly great for the consumer, but also very interesting for health geeks. Just why is there so much variation in costs?

Their work is getting good press from some important folks.

A JAMA Internal Medicine article,  “Variation in Prices for Common Medical Tests and Procedures” in November, reported on their initiative, PriceCheck, launched by KQED, KPCC and ClearHealthCosts to crowdsource health costs. PriceCheck found enormous variation,

“We next asked people to submit prices for lower back MRI. There was variation in prices paid by commercial insurers, government insurers, and cash prices. For CPT code 72148, we found that commercial insurers paid from $467 to $1567. But we found even greater variation when also reviewing additional types of payers not listed in the Table. Here, variation ranged from $255 to a self-pay price of $6221 at an academic medical center. The $255 price was for a patient covered by Medicare; the federal program’s payment was just a fraction of the facility’s charge of $2450.”

Following on the heels of the JAMA coverage, an article by Jeanne in the Harvard Business Review, and much more. I am most excited by the convergence of conversations across domains – from crowd sourced data to an editorial in JAMA. This is the way to address problems, and is a refreshing contrast to the days of yore when conversations in newspapers, television and academia did not overlap or cross-fertilize. Great to see the barriers breaking down, and a vigorous discussion emerge. Also great to see consumers meet and engage with health policy makers on common ground to address our irrational health cost structure, and, most inspiring, to see the profound value of information to shed light on areas needing transformation.

Very exciting!

NHANES – beyond nutrition to prescription meds

NHANES prescription medication data hasn’t always been on my radar.

I’m not sure why this was so. NHANES is a well known national survey that began as a nutrition survey and quickly expanded to include a range of health variables, including results of a physician exam and laboratory tests. It is a national probability based sample, which means that one can generalize from the NHANES to the entire United States, and its methodologic standards are of the very highest. Perhaps the reason that I overlooked the prescription medication data is that there is so much data, and also, that NHANES was known primarily for nutrition data. Getting past my own blind spot, I decided to take a closer look at the prescription medication data collected in NHANES.

Here are some key points.

The survey

NHANES began in the 1960s and was conducted in waves, with a NHANES I, NHANES II and NHANES III. We love it so much that it became a permanent fixture. Since 1999 it has been conducted continuously in two-year cycles, and is now called NHANES continuous, or just NHANES. The US population is sampled over a two-year cycle and the data need to be analyzed using the full two-year sample. The sample is representative of the non-institutionalized, U.S. population and for example, does not include residents in nursing homes, or people in prison.

Sample size

Sample size is critical to being able to estimate drug utilization. Unweighted sample sizes by age group are listed in the table below. While the numbers are large (every one of these people was interviewed in their homes), they may not be large enough for many purposes in pharmacoepidemiology. For those of us interested in pediatric medication use there were 4,194 people under 20 included in the sample. When stratified into age groups, the sample might not be large enough to study medications taken by small percentages (fewer than 1%) of children. The table below is taken from the NHANES website and shows unweighted sample sizes.

Table 2. Unweighted sample size and percents by age groups from NHANES 2005-06, 2007-08 and 2009-2010 for examined participants

NHANES prescription medications

NHANES prescription medication information

The medication information is collected during an in person interview in the participant’s home. During the interview, survey participants are asked if they have taken medications in the past 30 days for which they needed a prescription. Those who answer “yes” are asked to show the interviewer the medication containers of all the products used. For each medication reported, the interviewer enters the product’s complete name from the container into a computer. If no container is available, the interviewer asks the participant to verbally report the name of the medication. Participants are also asked how long they had been taking the medication and the main reason for use. This is in contrast to databases that rely on billing or claims data, or electronic health records. Documentation about the 2011-2012 data files containing prescription medication can be found here.

Using NHANES prescription medication data for pharmacoepidemiology

The pros and cons of using NHANES for pharmacoepidemiology are straight forward. On the pro side, NHANES may be the only probability based population sample in the United States with medication information. This alone makes it extremely valuable, and useful in conjunction with other types of data. The second strength, is that unlike health records, claims, or prescription data bases, the NHANES documents the presence of the medication in the patient’s home, demonstrating the the prescription was purchased and brought home. Along the continuum of measures, beginning with prescriptions written and prescriptions filled, documenting the prescription in the patient’s home brings us closer to understanding true exposures and levels of use. Another positive that needs to be explored is the availability of information from the physical exam and laboratory tests for the person using a given prescription.

On the con side, the sample sizes may be too small to provide stable estimates of many medications, especially if one wishes to study use within a sub-group. In terms of bias, my first thought is that this method of estimating use will result in underestimates of use, with people forgetting, omitting or otherwise not reporting their medication use to an interviewer. Misclassification in the other direction might occur when a person has filled a prescription and shows the prescription to the interviewer, but does not take the prescription. This latter source of bias would lead to an over-estimate of use but would also effect each of the other types of measures of prescription medication use (prescriptions written or prescriptions filled also over-estimate the numbers of people actually using the medication.

Recent publications using NHANES prescription medication data

A quick search turns up several publication analyzing prescription medication data in NHANES, but not as many as one might expect. An interesting use of the data is that of Bateman and colleagues (2012) focusing on a group with a risk factor, hypertension, and describing the medication use within that group. This usage may have applications for people working in health economics and outcomes research.

  • Farina EK, Austin KG, Lieberman HR, “Concomitant Dietary Supplement and Prescription Medication Use Is Prevalent among US Adults with Doctor-Informed Medical Conditions” J Acad Nutr Diet 2014 Apr 4 S2212-2672(14)
  • Bertisch SM, Herzig SJ, Winkelman JW, Buettner C, “National use of prescription medications for insomnia: NHANES 1999-2010” Sleep. 2014 Feb 1;37(2):343-9
  • Chong Y, Fryer CD, Gu Q, “Prescription sleep aid use among adults: United States, 2005-2010” NCHS Data Brief. 2013 Aug;(127):1-8
  • Gu Q, Burt VL, Dillon CF, Yoon S, “Trends in antihypertensive medication use and blood pressure control among United States adults with hypertension: the National Health And Nutrition Examination Survey, 2001 to 2010” Circulation. 2013 Jun 18;127(24)
  • Bateman BT, Shaw KM, Kuklina EV, Callaghan WM, Seely EW, Hernandez-Diaz S, “Hypertension in women of reproductive age in the United States: NHANES 1999-2008” PLoS One. 2012;7(4):e36171
  • Kinjo M, Setoguchi S, Solomon DH, “Antihistamine therapy and bone mineral density: analysis in a population-based US sample” Am J Med. 2008 Dec;121(12):1085-91

Pain meds used by children while in the hospital

Pediatric pain medications

When children are in the hospital, they often need pain relief or sedation, yet most drugs used for pain relief or sedation in children have not been studied in children. A first step in understanding the overall use of pain medications is to document the medications used and their frequency of use. Our publication, “Use of Analgesic, Anesthetic, and Sedative Medications During Pediatric Hospitalizations in the United States 2008”, published in the journal, Anesthesia and Analgesia in  2012, describes medications used in over 800,000 hospitalizations.

We describe use of analgesics, anesthetics, and sedatives in pediatric inpatients by conducting a statistical analysis of medication data from the Premier database. We identified all uses of a given medication, selected the first use for each child, and calculated the prevalence of use of specific medications among hospitalized children in 2008 as the number of hospitalizations in which the drug was used per 100 hospitalizations. Dose and number of doses were not considered in these analyses.

The dataset contained records for 877,201 hospitalizations of children younger than 18 years of age at the time of admission. Thirty-three medications and an additional 11 combinations were administered in this population, including nonsteroidal antiinflammatory drugs, local and regional anesthetics, opioids, benzodiazepines, sedative-hypnotics, barbiturates, and others. The 10 most frequently administered analgesic, anesthetic, or sedative medications used in this population were acetaminophen (14.7%), lidocaine (11.0%), fentanyl (6.6%), ibuprofen (6.3%), morphine (6.2%), midazolam (4.5%), propofol (4.1%), lidocaine/ prilocaine (2.5%), hydrocodone/acetaminophen (2.1%), and acetaminophen/codeine (2.0%).

Use changed with age, and the direction of change (increases and decreases) and the type of change (linear, u-shaped, or other) appeared to be specific to each drug.

Figure 1 shows the number and percentage of pediatric hospitalizations with nonsteroidal antiinflammatory drug (NSAID) use, by age group. Bars indicate number of hospitalizations. Lines indicate percentage of hospitalizations. Acetaminophen was considered in these analyses as an NSAID for the sake of categorical simplicity; however, pharmacologically, the antiinflammatory activity of acetaminophen is minimal, such that some do not consider it a true NSAID.

Pediatric pain medications by age group.

Figure 1. Number and percentage of pediatric hospitalizations with non steroidal anti-inflammatory drug (NSAID) use, by age group.

Figure 2 shows the number and percentage of pediatric hospitalizations with opioid use, by age group. Bars indicate number of hospitalizations. Lines indicate percentage of hospitalizations.

hospitalizations with use of pediatric pain medications (opioids), by age group.

Figure 2. Number and percentage of pediatric hospitalizations with opioid use, by age group.

See the accompanying editorial by Joseph Tobin, MD, “Pediatric Drug Labeling: Still an Unfinished Need”. As he says,

Chronic pain in children is seriously underrecognized in comparison with the prevalence of chronic pain in adults. This is one more circumstance in which labeling in children would be very beneficial to anesthesiologists and their patients.