Top

Author Archive | owner

Ebola – Is Public Health an Organized Sport, or Just a Pick-up Game?

The recent Ebola cases and fatality have triggered a collective process of finger pointing as we struggle to understand events and hold someone accountable.

Ebola Public Health

Hence, the television footage of health officials hauled off to Congress, accusatory headlines (“Alarming stumbles by the C.D.C.”) and appointment of czars. In the desire to pin the blame somewhere, notably the Centers for Disease Control and Prevention (CDC), we overlook the essential fact that in the United States public health responsibilities are fragmented among federal agencies, and decentralized throughout state and local government. The laws and regulations governing public health activities at federal, state and local levels is truly wonky terrain, but understanding these details is critical to being able to improve our response to public health emergencies. We need to know who actually has the authority to deal with specific public health functions and who should be held accountable (spoiler alert – it is not the Czar, nor the Secretary at DHHS, nor the Surgeon General, nor the Director of CDC). Often, it is a state health official, local health official or professional organization.

Let’s look at one of the most basic public health functions – disease surveillance and reporting. Reporting is the first step in preventing and controlling the spread of disease. We need to know about cases before we can take actions. One would think it would be mandatory. Not so. The US National Notifiable Diseases Surveillance System or NNDSS) is VOLUNTARY. The CDC role in this system is not voluntary, but is limited to receiving reports from states and publishing the data in an annual report.

Who decides which diseases are to be reported? “Public health officials at state health departments and CDC collaborate in determining which diseases should be nationally notifiable.” Do all states collect data on notifiable diseases? “States and jurisdictions are sovereign entities. Reportable conditions are determined by laws and regulations of each state and jurisdiction. It is possible that some conditions deemed nationally notifiable might not be reportable in certain states or jurisdictions.” This means that our national data and statistics on notifiable diseases are incomplete. Are states required to report notifiable diseases to the CDC? “Although disease reporting is mandated by legislation or regulation at the state and local levels, state reporting to CDC is voluntary”. This means that the state and local governments decide and mandate the data that are to be collected, not the CDC, not the federal government. The CDC works within this voluntary network to assemble and publish the best data it can.

The CDC is fundamentally an information organization. It conducts scientific investigations, analyzes laboratory samples, designs systems for collecting data, prepares and distributes information, publishes reports, and makes recommendations. It has relatively few powers. Authority to close down a restaurant? Local health departments. Authority to close a poultry plant? The US Department of Agriculture. Authority to recall a food item from the supermarket shelves? FDA, and, if it is a meat product, the US Department of Agriculture. What about the authorities to mandate that hospitals train their staff in safe procedures for treating Ebola, or mandate that hospitals maintain supplies of protective gear in the event of an Ebola case? I don’t know the answer to either of these questions, but I am betting that: a) it is different for each state, b) it may not exist in many states, c) the authority, if present, will reside in a hodge podge of state and local sanitation, labor, and health departments (protecting and training staff might be a labor issue as well as a health issue). While the CDC can recommend a certain level of preparedness, it does not have the powers to conduct audits or enforce recommendations. The level of preparedness at hospitals throughout the nation depends largely on decisions taken by hospital administrators to implement CDC recommendations, but there is no process in place to evaluate implementation or to correct inadequate implementation. Our only method of identifying non-adherence to recommendations is the occurrence of a major failure such as the one we have just seen at the hospital in Dallas.

The CDC prestige gives it some level of authority when making recommendations, but we shouldn’t confuse prestige with actual authority. CDC works effectively with states that value its input. In a foodborne outbreak, for example, states have the option of inviting the CDC to help it manage the outbreak – or not. When an outbreak is contained within state lines, the state health department is not required to call on the CDC, and not even required to report the outbreak – and some states don’t. As a result, the US has a calico pattern of statistics regarding foodborne outbreaks. States with strong food safety programs take a proactive approach to tracking down and identifying outbreaks, request CDC assistance with investigations, and report the outbreaks to the CDC; other states do just the opposite. Examine the CDC map that shows foodborne outbreaks by state. States with strong food safety programs have high rates of reported outbreaks! States with weak programs or no interest in reporting show few reported outbreaks. Take the example of Ohio, Indiana and Illinois, three bordering states that are fairly similar to each other. In 2012 Ohio and Illinois each reported 1.8 – 5.2 viral foodborne outbreaks per million (on the high end), but neighboring Indiana reported ZERO! Other states reporting zero viral foodborne outbreaks in 2012 include Mississippi, Missourri, Alabama, Arkansas, and West Virginia. The data reflect reporting behaviors rather than the information we need about occurrence of viral foodborne outbreaks.

Ebola public health

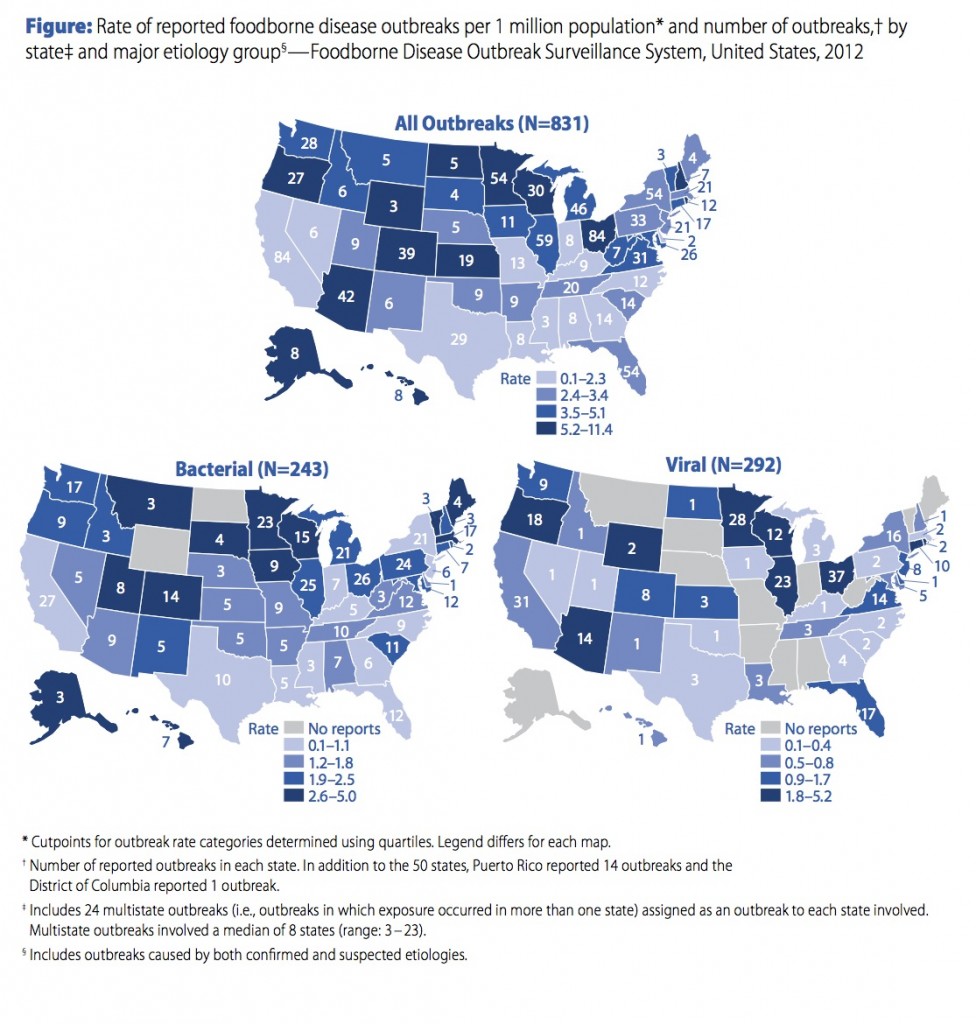
Food borne outbreaks, reported by state.

The pattern of fragmentation and decentralization is not limited to data reporting, but is repeated over and over throughout our health care system and public health infrastructure. Let’s not forget that the Supreme Court upheld the rights of states to opt out of the biggest national health initiative of the last 50 years, the Affordable Care Act Medicaid expansion. The rewards in public health are the rewards of doing interesting and important work. Every CDC employee (or ex-employee) that I have ever known works with amazing dedication and takes their responsibilities with the utmost seriousness. All see themselves as public servants, and I have never heard any of them complain about the lack of resources or any other aspect of their work. Blaming the CDC for our unpreparedness in the face of Ebola is probably the least productive thing we can do right now. Instead, we need to strengthen all the pieces of our decentralized public health network so that every American is protected in times of public health emergencies. Expecting an agency with relatively limited powers, such as the CDC, to be held accountable for failures in a decentralized network won’t get us where we want to be.

Top notch information about the Ebola virus

In the fast-moving events around the current Ebola epidemic, information has been essential. Fortunately, excellent communication and information resources are available. Here’s a quick cheat sheet to find quick and reliable Ebola information.

Begin with the Centers for Disease Control and Prevention, the government agency responsible for providing information on diseases to the public. Their Ebola information page covers Signs and Symptoms, Transmission, Risk of Exposure, Outbreaks, Prevention, Diagnosis, Treatment and specific issues Healthcare workers. There’s a chronological timeline, Clinical Guidances, and Communication Resources including factsheets, inforgraphics, Banners, Posters, Videos and more.

Ebola information - contact-tracing, from the CDC

CDC infographic on contact tracing.

The BBC website has plenty of good coverage, covering a lot of material simply and clearly. Their page includes a diagram of the virus and the infection process, a map showing where Ebola deaths have occurred and an interactive visual describing the different parts of the protective Ebola suit.

The leading medical journals provide a mix of resources that include editorials, discussions of ethics, and technical information about the status of research activities. These include The New England Journal of Medicine and JAMA, as well as the Lancet with its Ebola resource page, bringing an international perspective.

Improving Medicines for Children in Canada

“Studying medicines in children is always possible and is in their best interests”

A sentiment that can’t be repeated often enough.

The Council of Canadian Academies just released their report, Improving Medicines for Children in Canada, and while the title indicates a focus on Canada, much of the report is relevant to goal of improving medicines for children everywhere.

Children have historically been excluded from clinical trials and drug research to protect them from the risks of research.

As a result, there is a lack of information about medicines and how they affect children at different ages and stages of development. Throughout, the panel stresses the importance of including children in research,

The assumption that children must be protected from research is misguided. Children should be protected through research. Despite the many challenges to research with children, a range of methods and designs are increasingly accepted as ethically and scientifically sound. Demonstrating safety and efficacy of a medicine in studies with children is always feasible and desirable. It is now globally recognized that the medical community, the pharmaceutical industry, and regulatory agencies have an ethical responsibility to design, conduct, and report on high-quality studies of medicines in children.

Key findings

As with so much of the report, the key findings are applicable in the US, Europe and elsewhere. As they note,

  • Children take medications, many of which have not been proven safe and effective for their use.
  • Children respond to medications differently from adults; thus, medicines must be studied in children and formulated for children.
  • Studying medicines in children is always possible and is in their best interests.

The panel reviewed a comprehensive body of information and brings together relevant science from several disciplines. As such, it provides a cogent synthesis of the many issues around pediatric medication use. It begins with a description of the current environment and regulations, variation in children’s response to medications, issues around formulation, and covers current approaches to studying efficacy in children, monitoring and studying the safety of drugs used by children, and a thoughtful discussion around practices to support safe and effective products for children.

Off-label use

The overview of the current environment provides this useful chart summarizing different types of off-label practices, with examples of both the authorized (on-label) and off-label use.

Medicines for children

Off-label practices

Variability in response to medications

Chapter 3 includes this schematic of the factors affecting variability in children’s responses to medications.


Medicines for children

CCA schematic – drug response in children

They return to this issue in their conclusions, as they underscore the affect of human development from infancy to youth, and its affect on clinical pharmacology,

As children progress from infancy through to adolescence, a number of significant developmental changes occur. These changes impact how their bodies deal with medications (pharmacokinetics) and how medications, in turn, affect their bodies (pharmacodynamics). These factors cannot be accommodated by simply adjusting an adult dose. The physiological systems that process drugs change over time, with the most dramatic age-related physiological changes taking place during the first year of life. A newborn will respond to a drug differently than an adolescent will, and this variability in response is not a linear progression but rather a dynamic process dependent on age, weight, the drugs and conditions involved, and individual and environmental factors.

The report concludes with a fervent call to action,

Children’s right to health includes a right to medicines that are well-studied and approved for use in their age group. Children deserve timely and equitable access to safe and effective treatments and care, including participation in research.

The Expert Panel on the State of Therapeutic Products for Infants, Children, and Youth was chaired by Dr. Stuart MacLeod, Professor of pediatrics at the University of British Columbia in Vancouver.

Pharmacy practice and health disparities

Pharmacy practice may affect racial and ethnic health disparities through any one of three pathways

The pharmacy and health disparities

When we think about the most frequent interactions in pharmacy practice – filling and dispensing prescriptions – it isn’t immediately obvious how racial and ethnic disparities might manifest themselves, or how the pharmacy can affect health disparities. Research about such disparities in pharmacy practice is in its early stages, and we are just beginning to learn about ways in which these disparities might occur.

Pharmacy and health disparities

infographic for Chapter 5, which highlights the three ways racial and ethnic health disparities may arise in pharmacy practice.

Chapter 5 of “What Pharmacists Need to Know About Racial and Ethnic Health Disparities” describes the research emerging in three areas:

Racial or ethnic differences in disease conditions, response to medication, or use of medication

Advances in genomics and pharmacogenomics have provided information about the genetic distribution of traits linked to disease and to drug metabolism. Pharmacists working with different populations may encounter different prevalences of certain conditions, as well as differences in patient responses to specific medications.

Racial and ethnic differences in health literacy or understanding about health and medications

Racial and ethnic groups vary in their understanding about their health and the medications prescribed for them. This variation may result from differences in education, language limitations, or cultural issues.

Racial and ethnic differences in access to pharmacy care

The issue of access to care encompasses a broad range of factors, including access to health insurance, income, coverage by Medicare and other insurers. It also encompasses broader definitions of access. Geography and transportation limit people’s ability to access many types of services, including pharmacies. If a person doesn’t live near a pharmacy or has no access to transportation, their access is limited. Similarly, if the pharmacy in their neighborhood does not stock what they need, their access to the care they need is limited.

More about the role of pharmacists in eliminating racial and ethnic health disparities in the book, “What Pharmacists Need to Know About Racial and Ethnic Health Disparities”.

NHANES – beyond nutrition to prescription meds

NHANES prescription medication data hasn’t always been on my radar.

I’m not sure why this was so. NHANES is a well known national survey that began as a nutrition survey and quickly expanded to include a range of health variables, including results of a physician exam and laboratory tests. It is a national probability based sample, which means that one can generalize from the NHANES to the entire United States, and its methodologic standards are of the very highest. Perhaps the reason that I overlooked the prescription medication data is that there is so much data, and also, that NHANES was known primarily for nutrition data. Getting past my own blind spot, I decided to take a closer look at the prescription medication data collected in NHANES.

Here are some key points.

The survey

NHANES began in the 1960s and was conducted in waves, with a NHANES I, NHANES II and NHANES III. We love it so much that it became a permanent fixture. Since 1999 it has been conducted continuously in two-year cycles, and is now called NHANES continuous, or just NHANES. The US population is sampled over a two-year cycle and the data need to be analyzed using the full two-year sample. The sample is representative of the non-institutionalized, U.S. population and for example, does not include residents in nursing homes, or people in prison.

Sample size

Sample size is critical to being able to estimate drug utilization. Unweighted sample sizes by age group are listed in the table below. While the numbers are large (every one of these people was interviewed in their homes), they may not be large enough for many purposes in pharmacoepidemiology. For those of us interested in pediatric medication use there were 4,194 people under 20 included in the sample. When stratified into age groups, the sample might not be large enough to study medications taken by small percentages (fewer than 1%) of children. The table below is taken from the NHANES website and shows unweighted sample sizes.

Table 2. Unweighted sample size and percents by age groups from NHANES 2005-06, 2007-08 and 2009-2010 for examined participants

NHANES prescription medications

NHANES prescription medication information

The medication information is collected during an in person interview in the participant’s home. During the interview, survey participants are asked if they have taken medications in the past 30 days for which they needed a prescription. Those who answer “yes” are asked to show the interviewer the medication containers of all the products used. For each medication reported, the interviewer enters the product’s complete name from the container into a computer. If no container is available, the interviewer asks the participant to verbally report the name of the medication. Participants are also asked how long they had been taking the medication and the main reason for use. This is in contrast to databases that rely on billing or claims data, or electronic health records. Documentation about the 2011-2012 data files containing prescription medication can be found here.

Using NHANES prescription medication data for pharmacoepidemiology

The pros and cons of using NHANES for pharmacoepidemiology are straight forward. On the pro side, NHANES may be the only probability based population sample in the United States with medication information. This alone makes it extremely valuable, and useful in conjunction with other types of data. The second strength, is that unlike health records, claims, or prescription data bases, the NHANES documents the presence of the medication in the patient’s home, demonstrating the the prescription was purchased and brought home. Along the continuum of measures, beginning with prescriptions written and prescriptions filled, documenting the prescription in the patient’s home brings us closer to understanding true exposures and levels of use. Another positive that needs to be explored is the availability of information from the physical exam and laboratory tests for the person using a given prescription.

On the con side, the sample sizes may be too small to provide stable estimates of many medications, especially if one wishes to study use within a sub-group. In terms of bias, my first thought is that this method of estimating use will result in underestimates of use, with people forgetting, omitting or otherwise not reporting their medication use to an interviewer. Misclassification in the other direction might occur when a person has filled a prescription and shows the prescription to the interviewer, but does not take the prescription. This latter source of bias would lead to an over-estimate of use but would also effect each of the other types of measures of prescription medication use (prescriptions written or prescriptions filled also over-estimate the numbers of people actually using the medication.

Recent publications using NHANES prescription medication data

A quick search turns up several publication analyzing prescription medication data in NHANES, but not as many as one might expect. An interesting use of the data is that of Bateman and colleagues (2012) focusing on a group with a risk factor, hypertension, and describing the medication use within that group. This usage may have applications for people working in health economics and outcomes research.

  • Farina EK, Austin KG, Lieberman HR, “Concomitant Dietary Supplement and Prescription Medication Use Is Prevalent among US Adults with Doctor-Informed Medical Conditions” J Acad Nutr Diet 2014 Apr 4 S2212-2672(14)
  • Bertisch SM, Herzig SJ, Winkelman JW, Buettner C, “National use of prescription medications for insomnia: NHANES 1999-2010” Sleep. 2014 Feb 1;37(2):343-9
  • Chong Y, Fryer CD, Gu Q, “Prescription sleep aid use among adults: United States, 2005-2010” NCHS Data Brief. 2013 Aug;(127):1-8
  • Gu Q, Burt VL, Dillon CF, Yoon S, “Trends in antihypertensive medication use and blood pressure control among United States adults with hypertension: the National Health And Nutrition Examination Survey, 2001 to 2010” Circulation. 2013 Jun 18;127(24)
  • Bateman BT, Shaw KM, Kuklina EV, Callaghan WM, Seely EW, Hernandez-Diaz S, “Hypertension in women of reproductive age in the United States: NHANES 1999-2008” PLoS One. 2012;7(4):e36171
  • Kinjo M, Setoguchi S, Solomon DH, “Antihistamine therapy and bone mineral density: analysis in a population-based US sample” Am J Med. 2008 Dec;121(12):1085-91