Top

Archive | Epidemiology

Pain meds used by children while in the hospital

Pediatric pain medications

When children are in the hospital, they often need pain relief or sedation, yet most drugs used for pain relief or sedation in children have not been studied in children. A first step in understanding the overall use of pain medications is to document the medications used and their frequency of use. Our publication, “Use of Analgesic, Anesthetic, and Sedative Medications During Pediatric Hospitalizations in the United States 2008”, published in the journal, Anesthesia and Analgesia in  2012, describes medications used in over 800,000 hospitalizations.

We describe use of analgesics, anesthetics, and sedatives in pediatric inpatients by conducting a statistical analysis of medication data from the Premier database. We identified all uses of a given medication, selected the first use for each child, and calculated the prevalence of use of specific medications among hospitalized children in 2008 as the number of hospitalizations in which the drug was used per 100 hospitalizations. Dose and number of doses were not considered in these analyses.

The dataset contained records for 877,201 hospitalizations of children younger than 18 years of age at the time of admission. Thirty-three medications and an additional 11 combinations were administered in this population, including nonsteroidal antiinflammatory drugs, local and regional anesthetics, opioids, benzodiazepines, sedative-hypnotics, barbiturates, and others. The 10 most frequently administered analgesic, anesthetic, or sedative medications used in this population were acetaminophen (14.7%), lidocaine (11.0%), fentanyl (6.6%), ibuprofen (6.3%), morphine (6.2%), midazolam (4.5%), propofol (4.1%), lidocaine/ prilocaine (2.5%), hydrocodone/acetaminophen (2.1%), and acetaminophen/codeine (2.0%).

Use changed with age, and the direction of change (increases and decreases) and the type of change (linear, u-shaped, or other) appeared to be specific to each drug.

Figure 1 shows the number and percentage of pediatric hospitalizations with nonsteroidal antiinflammatory drug (NSAID) use, by age group. Bars indicate number of hospitalizations. Lines indicate percentage of hospitalizations. Acetaminophen was considered in these analyses as an NSAID for the sake of categorical simplicity; however, pharmacologically, the antiinflammatory activity of acetaminophen is minimal, such that some do not consider it a true NSAID.

Pediatric pain medications by age group.

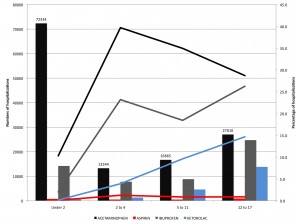
Figure 1. Number and percentage of pediatric hospitalizations with non steroidal anti-inflammatory drug (NSAID) use, by age group.

Figure 2 shows the number and percentage of pediatric hospitalizations with opioid use, by age group. Bars indicate number of hospitalizations. Lines indicate percentage of hospitalizations.

hospitalizations with use of pediatric pain medications (opioids), by age group.

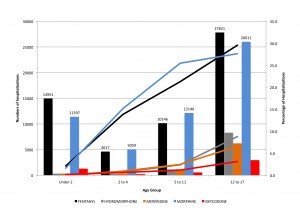
Figure 2. Number and percentage of pediatric hospitalizations with opioid use, by age group.

See the accompanying editorial by Joseph Tobin, MD, “Pediatric Drug Labeling: Still an Unfinished Need”. As he says,

Chronic pain in children is seriously underrecognized in comparison with the prevalence of chronic pain in adults. This is one more circumstance in which labeling in children would be very beneficial to anesthesiologists and their patients.

Pediatric hospitalizations for mood disorders

Children get hospitalized for depression and bipolar disorders.

I wasn’t aware of how frequently this happens until I got my hands on some BIG DATA – the HCUP KID database of children’s hospitalizations. My colleagues and I analyzed hospitalizations in 2000, 2003 and 2006 and published our results in the journal, Child and Adolescent Psychiatry and Mental Health in 2011. For each of these years, we were able to look at records for over 2 million hospitalizations, and able to project these to the entire number of pediatric hospitalizations in the US in those years.

Some take home points

Percentages of hospitalizations where the principal diagnosis was a mental health diagnosis

  • In children age 15-17, 13.7 to 15.2% of hospitalizations had a mental health principal diagnosis
  • In children age 10-14, 15.0 to 15.6% of hospitalizations had a mental health principal diagnosis
  • In children age 5-9, 4.4 to 4.8% of hospitalizations had a mental health principal diagnosis accounted

The incidence of hospitalizations with mood disorders as the principal diagnosis compared to the entire population of children

12.1-13.0 out of every 10,000 children were hospitalized with mood disorders as the principal diagnosis in 2000-2006.

Age

The incidence of hospitalizations for children with mood disorders increased with age – this figure uses data from 2006 to show the trend.

Children mood disorders by age

Region of the country

A surprising finding was the big differences between regions of the country. As an example, in 2006, the Western region experienced the lowest rates (10.2/10,000) while the Midwest had the highest rates (25.4/10,000). This figure shows the rates for 2000, 2003 and 2006.

children mood disorders by region of the US

Did you know?

Mood disorders including depression and bipolar disorders are a major cause of morbidity in childhood and adolescence, and hospitalizations for mood disorders are the leading diagnosis for all hospitalizations in general hospitals for children age 13 to 17.

Between 2000 and 2006, inflation-adjusted hospital charges increased from $10,600 to $16,300.

Ch 3 Health disparities associated with race and ethnicity

Health disparities statistics

Chapter 3 of “What Pharmacists Need to Know About Race and Ethnicity” presents the data documenting disparities in mortality, morbidity, provision of health care, and other health indicators by race and ethnicity. The attached infographic highlights differences in life expectancy. Students are always startled to see the data and it always provokes questions and interest.

Health disparities statistics

Health disparities occur along the causal pathway from exposures and risk factors to all health outcomes.

The chapter explores disparities in life expectancy, mortality, incidence of disease, risk factors, and access to care, allowing students to explore the disparities along the pathways from causal factors to health outcomes. Students apply their skills in epidemiology, data analysis and statistics and gain a deeper understanding of how health disparities are manifested.

The figures and data are drawn from a range of government sources including the Centers for Disease Control and Prevention, Agency for Healthcare Research and Quality, and Health Resources and Services Administration. All provide extensive documentation and resources for further study, such as the CDC Health Disparities and Inequalities Report.

Variation in Vancomycin Use in Pediatric Hospitalizations in the 2008 Premier Database

How much variation in use is too much?

Vancomycin is indicated for the treatment of serious or severe infections caused by susceptible strains of methicillin-resistant (beta-lactam-resistant) staphylococci.  Because of concerns about the development of drug-resistant bacteria, recommendations to prevent the spread of vancomycin resistance have been in place since 1995 and include guidelines for inpatient pediatric use of vancomycin.  With such guidelines in place, it is of special interest to compare inpatient pediatric vancomycin administration across hospitals.

Our recent publication, “Pediatric Vancomycin Use in 421 Hospitals in the United States 2008” published in PLOS ONE on 8/16/2012 (Lasky T, Greenspan J, Ernst FR, and Gonzalez L), compares vancomycin use in all pediatric hospitalizations (hospitalizations of children under age 18) in 421 hospitals in the Premier database.

Key Findings

  • Vancomycin was administered to children at 374 hospitals in the Premier hospital database.
  • Another 47 hospitals with 17,271 pediatric hospitalizations (13,233 under age 2) reported no vancomycin use during 2008.
  • The number of pediatric hospitalizations with vancomycin use ranged from 0 to 1225 at individual hospitals.
  • Most hospitals (221) had fewer than 10 pediatric hospitalizations with vancomycin use in the study period.
  • 21 hospitals (5.6% of hospitals) each had over 200 hospitalizations with vancomycin use, and together, accounted for more than 50% of the pediatric hospitalizations with vancomycin use.
  • Percentage of hospitalizations with vancomycin use ranged up to 33.3% when hospitals with few pediatric hospitalizations were kept in the sample, the high percenetages being an artifact of the small number of hospitalizations in the denominator. For this reason, percentage, by itself, may not be a useful indicator in small hospitals.
  • In hospitals with more than 100 pediatric hospitalizations with vancomycin use, the percentage with vancomycin use ranged from 1.26 to 12.90, a 10 fold range in the prevalence of vancomycin use.
  • Our stratified analyses and logistic modeling showed variation in vancomycin use by individual hospital that was not explained by hospital or patient characteristics including: bed size, teaching status, region of the country, rural or urban geography, and patient sex, race, APR-DRG risk of mortality and APR-DRG severity of illness.

For Discussion and Further Investigation

Until recently, few studies have compared pediatric antibiotic use across large numbers of hospitals or geography, and it was not possible to assess variation in use across institutions. Hospital variation in care of adults has been studied for several decades, much of it made possible by large Medicare claims databases. With the availability of aggregated data for pediatric hospitalizations we can begin describing and attempting to understand variation in pediatric practice. This first study of hospital variation in pediatric vancomycin use raises questions for further research.

Crowdsourcing to obtain study samples and conduct epidemiologic surveys

It seemed like a fanciful idea, but the title caught my eye, “Crowdsourcing Graphical Perception: Using Mechanical Turk to Assess Visualization Design” (Jeffrey Heer, Michael Bostock ACM Human Factors in Computing Systems (CHI), 203–212, 2010).

OK, google “Mechanical Turk” – it is a service from Amazon that matches “workers or Turkers” with “requestors” for small tasks and asked “workers” to assess different visualization  designs.  If you know this already, you are way ahead of where I was last Tuesday. The authors got 186 respondents to assess some  visualizations for a total study cost of $367.77, and the authors were able to compare their study results to published literature to conclude that the method was viable.  If “Turkers” can assess visualizations, then they presumably they can respond to other types of questionnaires or surveys about a range of issues.

This piqued my curiosity, and I searched for more information on this issue.  One of the first questions of concern to any epidemiologist would be the degree and types of selection biases associated with using crowdsourcing and related approaches to obtain what are essentially survey samples and responses. I was surprised to see a growing body of literature in this arena, the most recent of which is Jennifer Jacquet’s article,on the Scientific American blog (July 7, 2011), “The Pros and Cons of Amazon Mechanical Turk for Scientific Surveys” (aren’t surveys some of what we do?).

I found several other studies characterizing the demographics of samples of respondents on Mechanical Turk:

“The New Demographics of Mechanical Turk”, March 9, 2010 Panos Ipeirotis, NYU School of Business, www.behind-the-enemy-lines.com/2010/03/new-demographics-of-mechanical-turk.html

Ross, Irani, Silberman, Zaldivar and Tomlinson, “Who are the Crowdworkers? Shifting Demographics in Mechanical Turk” CHI 2010, www.ics.uci.edu/~jwross/pubs/RossEtAl-WhoAreTheCrowdworkers-altCHI2010.pdf

Going further, some folks are pursuing the idea of using this methodology for subject recruitment in experimental research: “Using Mechanical Turk as a Subject Recruitment Tool for Experimental Research”, Berinsky, Huber and Lenz, October 7, 2011,

Clearly, some very bright minds are exploring the potential of this mechanism.  I would think that we epidemiologists will have a lot to contribute in this arena, and will see great benefits, as well.