Top

Author Archive | owner

Epidemiology and data visualization

We’ve always understood the value of data visualization

John Snow

If you’ve taken a look at any overview about epidemiology, or attended one lecture on the subject, you’ve heard of John Snow, the Victorian anesthesiologist, who tromped around London in his spare time, asking people about their water supply (water was delivered by different companies, and drawn from different pumps, accordingly). He associated one water supplier with a higher incidence of cholera deaths, inferring that something in the water was causing cholera – and this was before scientists had embraced the germ theory, and well before pathogens had been identified as causes of infectious disease.

Data visualization

John Snow’s map showing cases of cholera in 19th century London.

In addition to his excrutiating hand calculations of infections and death rates, he mapped the data. We can see references to his maps on all kinds of data visualization sites. Epidemiologists have always known about his maps; now they are garnering attention from non-epidemiologists.

Florence Nightingale

Another Victorian who didn’t mind using pencil and paper to add up lots and lots of numbers, was Florence Nightingale. Yes, the lady with the lamp, was also an ardent mathematician/statistician. She invented a type of diagram, “coxcombs” to visualize mortality by different causes.

Data visualization

Florence Nightingale called these diagrams, “coxcombs”.

But was she an epidemiologist? The term “epidemiologist” wasn’t in use when she was doing her work, but “she used statistics to measure health, identify causes of mortality, evaluate health services, and reform institutions.” (Stolley and Lasky, Investigating Disease Patterns, 1995).
Systematic Literature Review – a quick overview

Recently, I conducted a training workshop for a company conducting systematic literature reviews.

The group was young, energetic, hardworking. The biggest problem? Communicating with the clients. This is a field that is growing rapidly, and the buzz is getting louder. Clients want and need systematic literature reviews, and they want one that has every bell and whistle and covers every conceivable question. How to communicate to clients the importance of a focused approach, and the benefits of restricting a search?

I began with an overview of the basics.

Systematic literature review is an organized method of locating, assembling, and evaluating a body of literature on a particular topic using a set of specific criteria. The systematic review may also include a quantitative pooling of data, called a meta-analysis.

Younger professionals starting out may not know how “literature reviews” used to be done. I call it, “The Old Way of gathering information.” We used to go to our bookshelf, pull down a textbook, take the list of references to the library, and obtain and read references (remember standing in line for the photocopier?). Maybe we would search for references cited in first batch of references, and then we would write our “review”. Even then, we should have considered the problems. Text books are not current or comprehensive and the approach is highly variable; different people have different text books on their book shelves and will come up with different groups of references, resulting in variability in conclusions. As the volume ?of information increased over the past decades, the old approach became impractical and insufficient.

Some very far-sighted thinkers began exploring the scientific challenges of combining information from more than one study, as a way of coping with the increasing volume and pace of information flow, and synthesizing conflicting findings from different studies. Fast forward to the present, and a highly developed methodology that is used throughout the world to address a range of scientific questions:

  • Find out what’s been done
  • Identify research gaps
  • Refine research questions
  • Assess medication efficacy and safety

These questions have relevance to guideline developers, clinicians, pharmaceutical companies, regulatory agencies, insurers, and others.

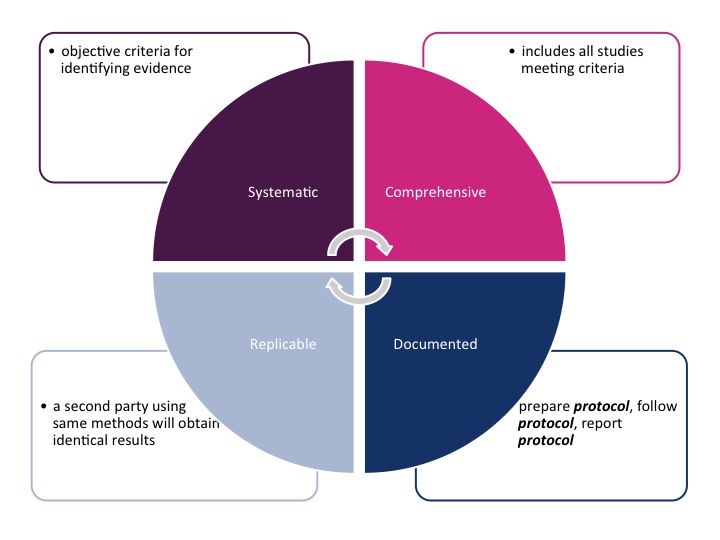
This figure illustrates the key attributes of systematic literature reviews.

Systematic literature review

Systematic literature reviews are: Systematic, Comprehensive, Replicable, and Documented. It looks simple, but it involves careful methodology and attention to detail.

Fortunately there is a growing body of resources available, including three of my favorites:

In addition to providing workshops and training in systematic literature review and meta-analysis, Dr. Lasky co-taught the student workshop on Systematic Literature Review and Meta-analysis in Pharmacoepidemiology at ICPE 2013.

Ch 4 Mechanisms of health disparities

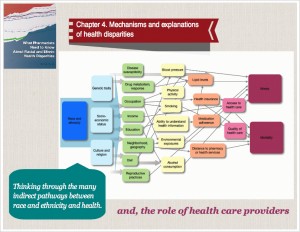
Infographics are a great way to begin a discussion about mechanisms of health disparities.

Infographic mechanisms of health disparities

Conceptual model: Mechanisms of health disparities

This infographic illustrates multiple potential pathways leading from race and ethnicity to disparities in health outcomes, mechanisms of health disparities. Chapter 4 of “What Pharmacists Need to Know About Racial and Ethnic Health Disparities” explores mechanisms and explanations and provides students with tools for understanding this complex topic.

The visual can provoke thought, raise questions, and educate, all at the same time. The infographic suggests pathways, but doesn’t cover them all. The student can take this infographic, generate hypotheses, and explore relationships.

For example, a student might begin with the association between race and ethnicity and socio-economic status, and then follow the pathways leading through occupation, income, education or neighborhood, which then lead through variables such environmental exposures, ability to understand health information or health insurance coverage, and then to health outcomes.

Another set of pathways might begin with the association between race and ethnicity and culture and religion (another broad area, in itself). One can follow the pathways through behaviors such as diet, reproductive practices, attitudes towards medication, education and occupation, and lead to differences in risk factors and health outcomes.

Chapter 4 also explores direct effects of race or ethnicity on health – and discusses the landmark study “The effect of race and sex on physicians’ recommendations for cardiac catheterization” that was published in the New England Journal of Medicine in 1999.

“What Pharmacists Need to Know About Racial and Ethnic Health Disparities” – a text tailored for pharmacy students.

Available on amazon.com

Book Review

“What Pharmacists Need to Know About Racial and Ethnic Health Disparities”

Book review pharmacy health disparities

Great to see this thoughtful book review of “What Pharmacists Need to Know About Racial and Ethnic Health Disparities” in the American Journal of Pharmaceutical Education.

Dr. Christine Catney, of the University of Iowa College of Pharmacy reviewed the text, recommending the book.


She wrote,

Pharmacy educators who are developing materials and approaches for teaching health disparities and cultural competence topics will appreciate the author’s suggestions for assignments and learning activities. Examples of these ideas include examining census forms, preparing reports to illustrate and explain specific health disparities in detail, and generating examples from students’ pharmacy practice experiences. Several of these ideas, as well as examples provided within the text, could be transformed into small group activities for a flipped classroom approach.

Teaching about pharmacy health disparities

She also pointed out the need to cover other disparities that are affected by factors such as income, gender, age (under 18 years and 65 years and over), geographic location, sexual orientation, disability, and special or chronic care needs, and I couldn’t agree more.

There are so many issues in considering pharmacy health disparities, and the important thing is to begin the discussion. The classroom is the right place to generate lively discussion about pharmacy health disparities and the pharmacist’s role in addressing disparities. Learning about health disparities during professional training is a first step towards cultural competence and equips students to engage in these issues throughout their lives and careers.

Visualizing Health

From the Robert Wood Johnson Foundation and the University of Michigan Center for Health Communications Research

We’re starting to see the fruits of all the excitement about data visualization and health, notably this thorough report from Visualizing Health, a project of the Robert Wood Johnson Foundation and the University of Michigan Center for Health Communications Research.

As they state,

In theory, data can help us make better decisions about our health. Should I take this pill? Will it help me more than it hurts me? How can I reduce my risk? And so on.

But for individuals, it’s not always easy to understand what the numbers are telling us. And for those communicating the information – doctors, hospitals, researchers, public health professionals — it’s not always clear what sort of presentation will make the most sense to the most people.

Their web site contains examples of tested visualizations, and what’s especially nice, they’ve done research assessing reactions from the general public. They’ve created a gallery of graphs, charts, and images, and they’ve done the hard work of evaluating them.


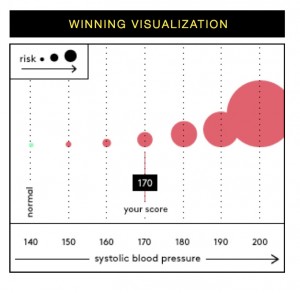
from Visualizing Health, one of their data visualizations

one of their data visualizations

Among the goodies, a “wizard” tool to help you learn more about a risk you want to communicate, and a sample risk calculator that shows off some of the best design concepts.

I like the way they’ve identified use cases:

  • Tradeoffs between medication or treatment options?
  • Relating biomarkers (such as BMI or cholesterol levels) to risk?
  • Health risk assessment output?
  • Population risks: disparities?
  • Population risks: emergent disease (“Should I worry about that measles outbreak?”)
  • Understanding multiple side effects?Understanding unique side effects?
  • Motivating a risk-reducing action?
  • Understanding tradeoffs that change over time over time?
  • Small risks, and understanding how to reduce small risks?
  • Explaining what “average years saved” means for an individual person?

I like the way they describe their methodology, using three tools to test their images (google consumer surveys, survey sampling international, and amazon mechanical turk). Transparency is always appreciated!

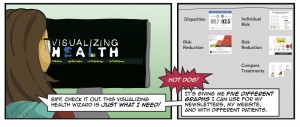
And, at the back of the report (why at the back?) a comic book style presentation on visualizing health in practice, using images to educate patients about diabetes.

about health literacy

about health literacy